IIFT2013QuestionPaper Related Question Answers
1. In each of the questions given below which one of the five answer figures on the right should come after the problem figures on the left, if the sequence were continued ?
6.
Choose the word which is MOST OPPOSITE in meaning to the word printed in bold as used in the passage.CAPRICIOUS
7.
Given below are the shares of sectoral FDI inflow to India in different years (figures in percentage). Answer the questions on the basis of following data.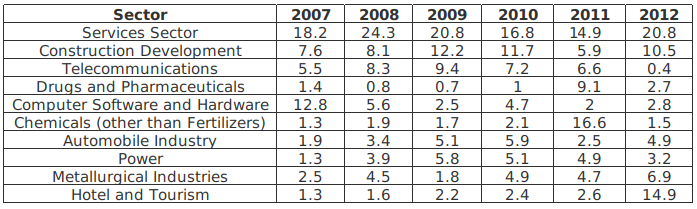 Among the four sectors mentioned below, the increase in share of FDI inflow between the terminal years 2007 and 2012 has been HIGHEST for
10. Identify the TRUE alternative from the given options based on the following statements i. In 2011, the construction development sector was ranked fifth in terms of percentage share of FDI inflow in the country ii. In 2009, the Computer Software and Hardware sector was ranked sixth in terms of percentage share of FDI inflow in the country iii. In 2012, the drugs and pharmaceuticals sector was ranked fourth lowest from the bottom in terms of percentage share of FDI inflow in the country
12.
Given below are the shares of India’s export basket to different regions (figures in percentage). Answer the questions on the basis of following data.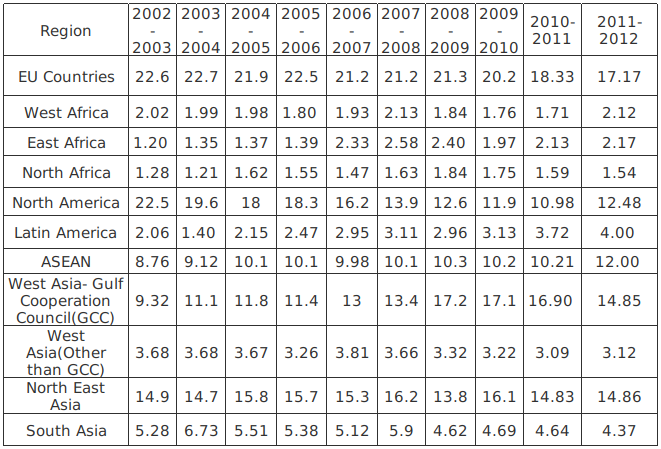 Among the four options mentioned below, export share of India witnessed HIGHEST year-to-year decline in absolute terms in which of the region-period combinations?
13. Among the four options mentioned below, for which region have the export shares declined maximum number of times in a year-on-year basis?
14. Between 2009-10 and 2010-11, the annual growth rate in India’s (percentage) export shares has been LOWEST for
16.
Given below are the detailed characteristics of select India industries. Answer the question on the basis of the following data. If total ,managerial wage bill is defined as the difference between total emoluments and total wage to workers, and total managerial staff is defined as the difference between total person engaged and total number of workers, then average managerial wage would be HIGHEST for:
18. If gross value added is defined as the sum of net value added and depreciation, then the difference in the gross value added per worker is maximum between which of the following paira?
21.
Given is information relating to cost of starting a business and number of days required for specific business activities in select countries. Answer the questions on the basis of the data in the following figure. The data labels for the bars are placed above them, while the same for the line graph are placed in boxes. Legend for the bars is given in the order of left bar to the right bar. If countries were ranked according to the number of days required to start a business, (with the country requiring least number of days being rank highest), which of the top three countries would have the least cost to per capita income ratio?
23.
Read the following passage and solve the questions based on it.
a.Six Indian professors from six different institutions (Jupiter, Mars, Mercury, Neptune, Pluto, Uranus) went to China to attend an international conference on “Sustainability and Innovation in Management: A Global Scenario” and they stayed in six successive rooms on the second floor of a hotel (201 _ 206).
b.Each of them has published papers in a number of journals and has donated to a number of institutions last year.
c.The professor in room no. 202 has published in twice as many journals as the professor who donated to 8 institutions last year.
d.The professor from Uranus and the Professor in room number 206 together published in a total of 40 journals.
e.The professor from Jupiter published in 8 journals less than the professor from Pluto but donated to 10 more institutions last year.
f.Four times the number of 4 journal publications by the professor in room number 204 is lesser than the number of institutions to which he donated last year.
g.The professor in room number 203 published in 12 journals and donated to 8 institutions last year.
h.The professor who published in 16 journals donated to 24 institutions last year.
i.The professor in room number 205 published in 8 journals and donated to 2 institutions less than the professor from Mercury last year. The Mercury professor is staying in an odd numbered room.
j.The Mars professor is staying two rooms ahead of Pluto professor who is staying two rooms ahead of the Mercury professor in ascending order of room numbers.
k.The professors from Mercury and Jupiter do not stay in room number 206.In which room is the Mars professor staying?
 Powered By:Omega Web Solutions
© 2002-2017 Omega Education PVT LTD...Privacy | Terms And Conditions